


$2.5K STARTING DAILY REVENUE | $18.6K PEAK SINGLE DAY REVENUE | 464 ORDERS IN A SINGLE DAY | 20 SKUS UNLOCKED & TESTED |
About The Brand
This is an anonymised fragrance brand with a catalogue of 20 distinct SKUs. They weren’t a struggling brand when they came to us — they had real revenue, real customers, and a product range people genuinely wanted. But the scale of the operation didn’t reflect the scale of the opportunity. They were generating a few thousand dollars a day and had no clear system for pushing beyond it.
The size of their catalogue was both the opportunity and the challenge. Twenty SKUs is a lot to manage creatively. Most brands in this position default to picking five ‘hero’ products and going hard on those. It feels like the logical move. It’s also how you leave most of your revenue on the table.
The Challenge
The brand was doing $2,000–$2,500 a day. Solid, consistent, real. But they were operating well below their ceiling and didn’t have a clear path to find it. A 20-SKU catalogue was being partially represented in their ads — a small selection of products carrying the weight of an account that had far more to offer.
The bigger problem wasn’t which products to push. It was that nobody knew which products would win at scale until they were actually tested. And without a systematic approach to offer structure — how products were priced, packaged, and positioned in the creative — even the right products wouldn’t convert at their potential.
The Core Problem A strong brand with a large catalogue, no creative system, and no offer testing framework. Revenue was real but capped. The question wasn’t whether this brand could scale — it was how fast, once the right system was in place. |
The Insight
The fragrance category has something most e-commerce categories don’t: genuine breadth of appeal across a wide range of products. People don’t just want one scent. They browse, they discover, they buy based on what catches them. That browsing behaviour is actually an advantage if the creative system is set up to work with it rather than against it.
Most brands narrow their catalogue in paid media because managing 20 SKUs in ads feels complicated. The instinct is to simplify — pick the bestsellers, run hard, see what happens. But that instinct ignores two things: the bestsellers in organic traffic aren’t always the bestsellers in paid, and the offer structure around a product can change its performance completely regardless of how popular the scent is.
The insight that drove our approach was this: don’t decide what wins before the data does. Open the whole catalogue. Test offers across every format — bundles, volume deals, single-SKU variations. Build creative that represents the full range. Then let the numbers tell you where to concentrate.
Offer-First Thinking Creative is how you get attention. Offer is how you get the sale. Getting both right at the same time — across 20 SKUs simultaneously — is how you find scale that a narrower approach would have missed entirely. |
What We Did
The Audit
Day one was about understanding the full picture. What was running, what had been tested before, which SKUs had any data behind them, and how the offer structure had been approached historically. The audit shaped everything that followed — it told us where the gaps were and confirmed that the catalogue was being underutilised in exactly the way we expected.
Offer Testing Across the Full Catalogue
Rather than making assumptions about what would sell, we ran systematic offer testing across all 20 SKUs from the start. This wasn’t a slow, sequential process — it was broad and simultaneous. Three types of offers were tested in parallel:
Bundle deals — pairing SKUs together at a combined price point to increase average order value and give customers a reason to try more than one product.
Volume discounts and tiered pricing — giving customers a better deal for buying more, which in a fragrance context maps naturally to how people actually shop. They want options.
Single-SKU offer variations — testing different price points, urgency mechanics, and positioning around individual products to find the offer structure that converts best per SKU.
The results weren’t all predictable. Some expected bestsellers performed exactly as anticipated. Others surprised us — SKUs that hadn’t been featured heavily in ads before started converting at a rate that justified shifting creative budget toward them. A few products that looked strong on paper underperformed against others that hadn’t been given much attention. That’s what systematic testing reveals that gut instinct never does.
Full-Catalogue Creative
Creative was built to represent the entire range — not a curated shortlist. Statics led the volume at this stage, built across multiple formats and offer types for the SKUs showing early traction. Videos followed, extending the angles that were already working in static format.
The creative wasn’t just showing products. It was showing the offer. The bundle. The value. The reason to buy now and buy more than one. That’s a different kind of creative brief than ‘make this product look good’ — and it’s what the performance data from early February reflects.
Weekly Review — Data Leads, We Follow
Every week, a full review of everything produced and everything performing. Winners were identified and scaled. Underperformers were cut without sentiment. New SKU and offer combinations were introduced based on what the data was pointing toward. The catalogue shrank over time — not because we stopped believing in the products, but because the market told us clearly which ones it wanted most.
The Results
Three clear phases. Each one tells a different part of the story.
Phase | Daily Revenue | Daily Orders | Conv. Rate | What Was Happening | Status |
|---|---|---|---|---|---|
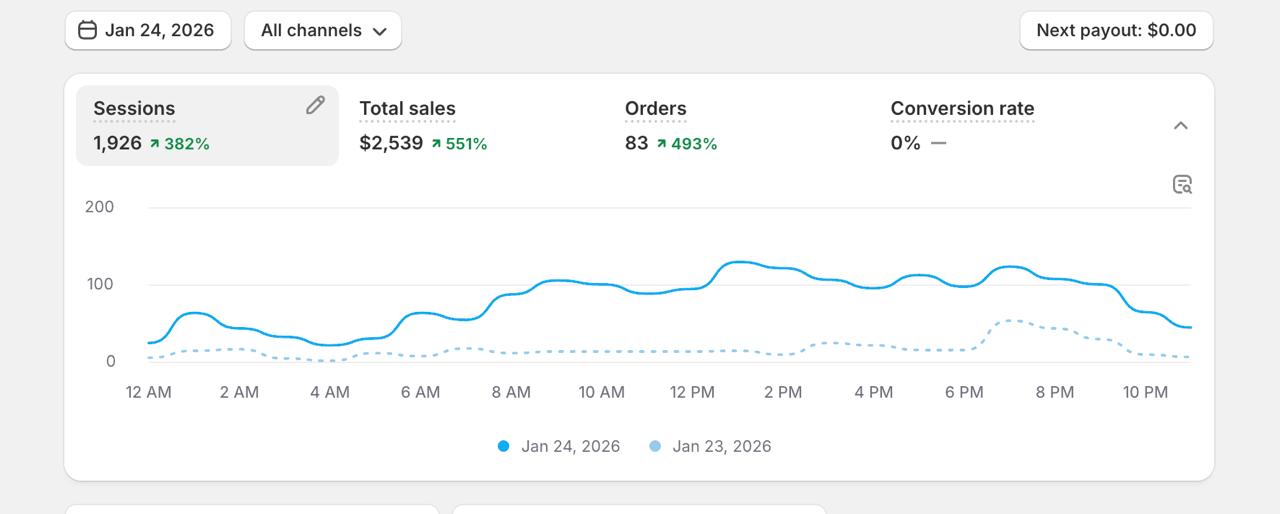
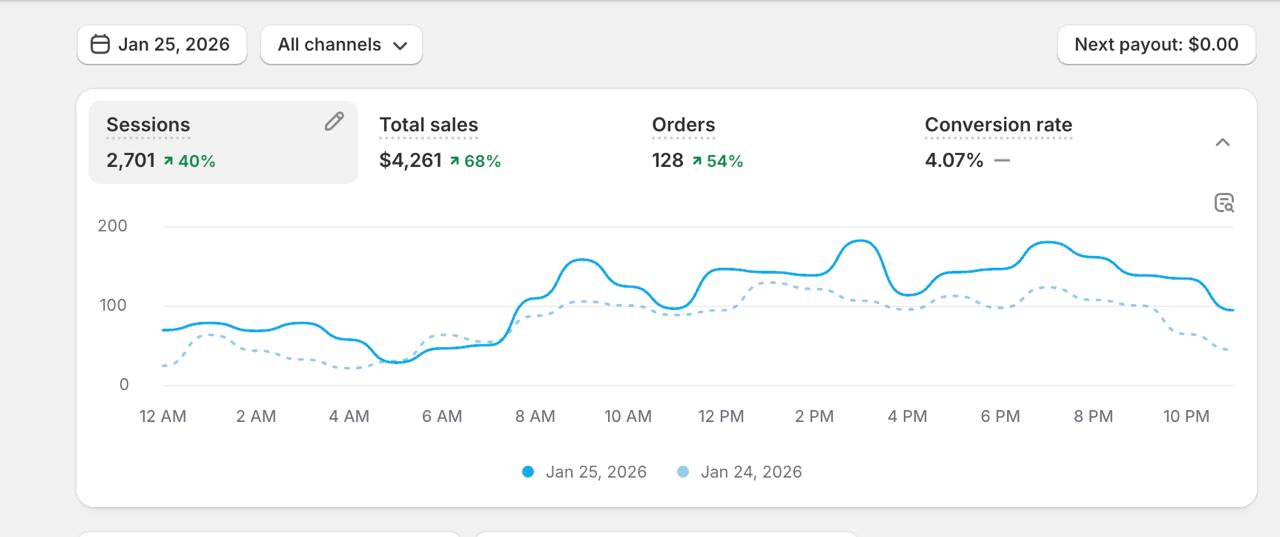
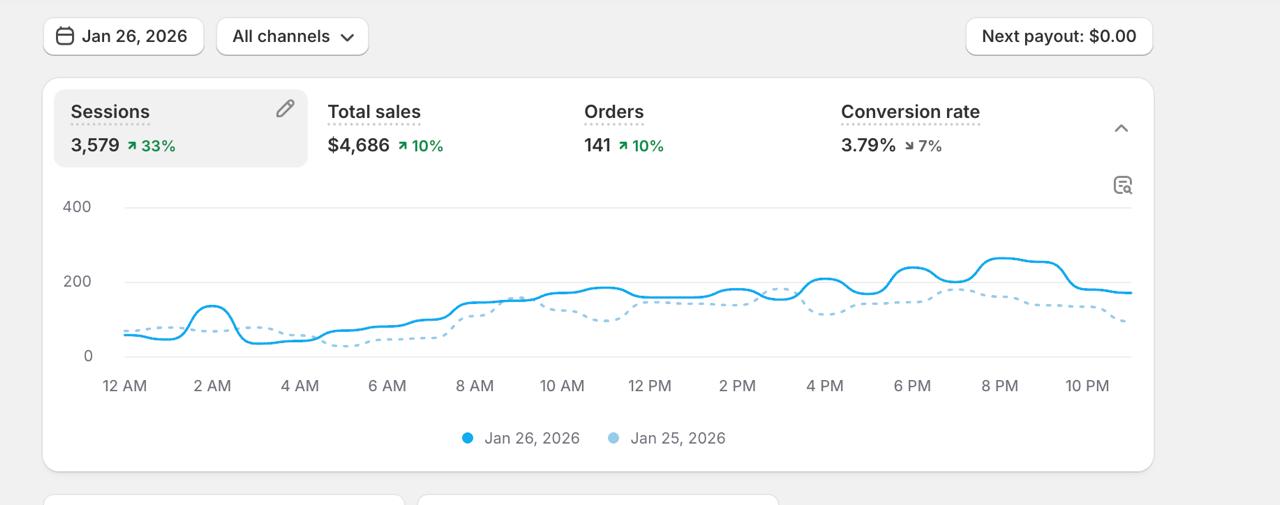
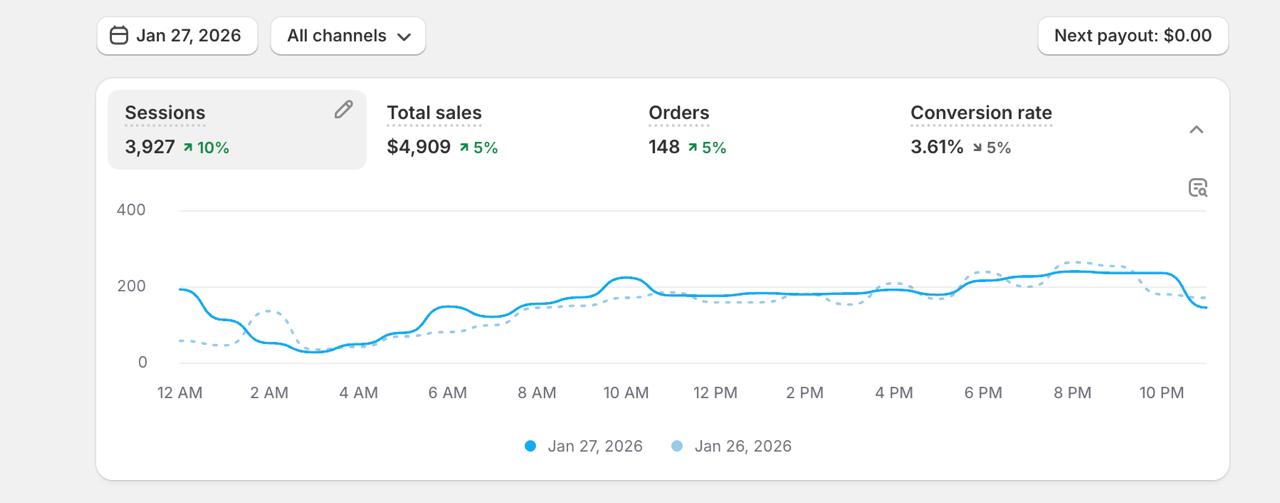
January The Ramp Jan 24–27 | $2,500–$4,900/day | 83–148/day | 3.6–4.1% | Partnership begins. Offer testing kicks off across the full SKU range. Early data starts shaping the direction. | BUILDING |
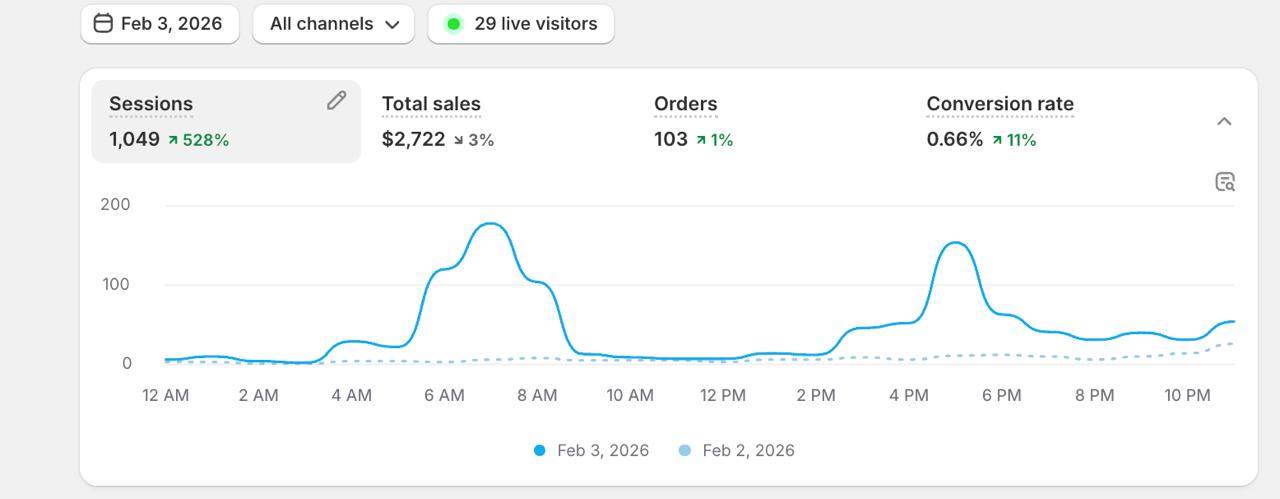
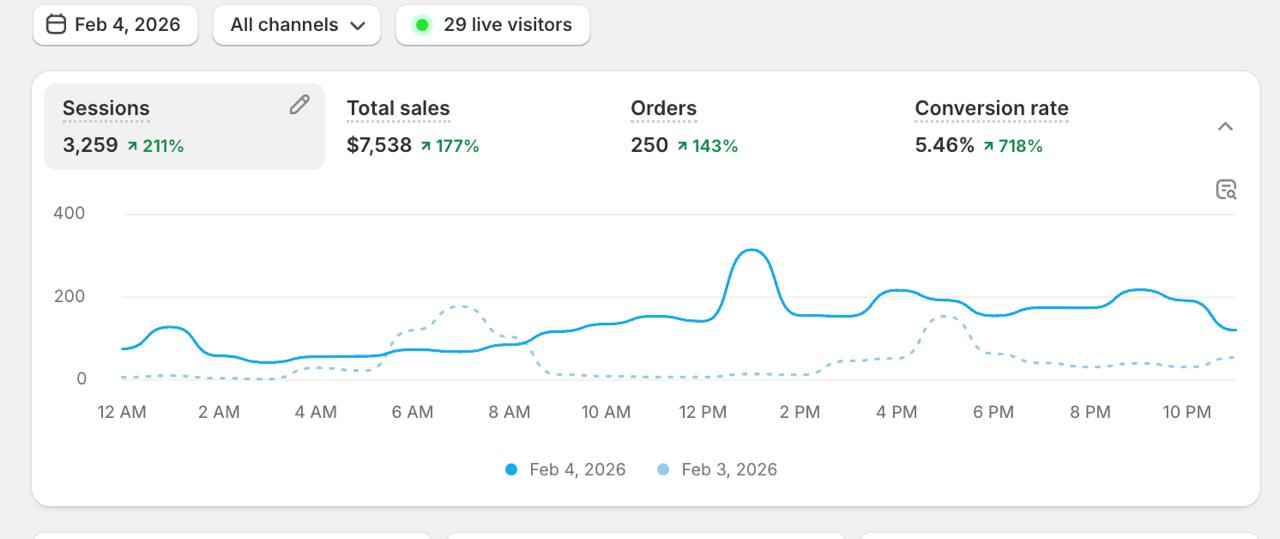
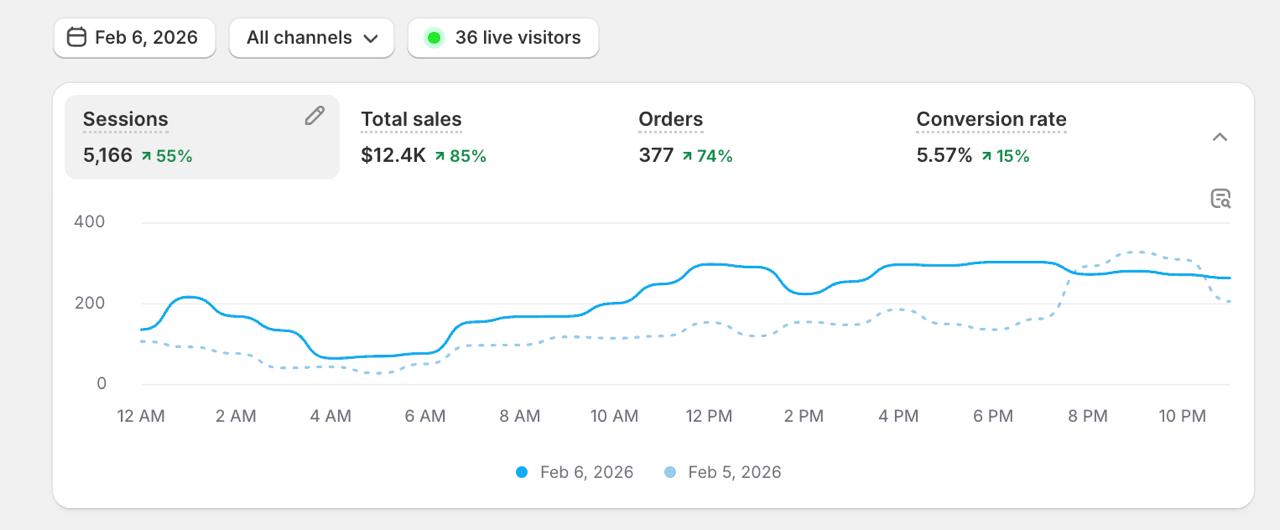
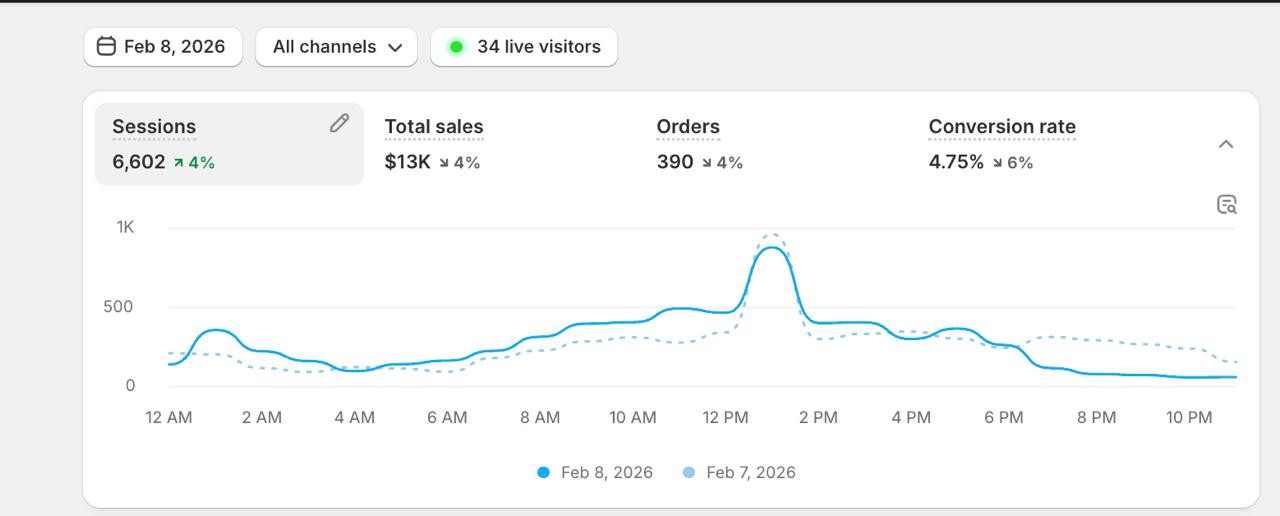
Early Feb The Explosion Feb 3–8 | $2,700–$13K/day | 103–390/day | 4.75–5.57% | Winning offer structures and SKUs identified. Creative locks in. Feb 4 alone: $7,538 and 250 orders. Feb 6: $12,400. The account shifts to a completely different level. | BREAKTHROUGH |
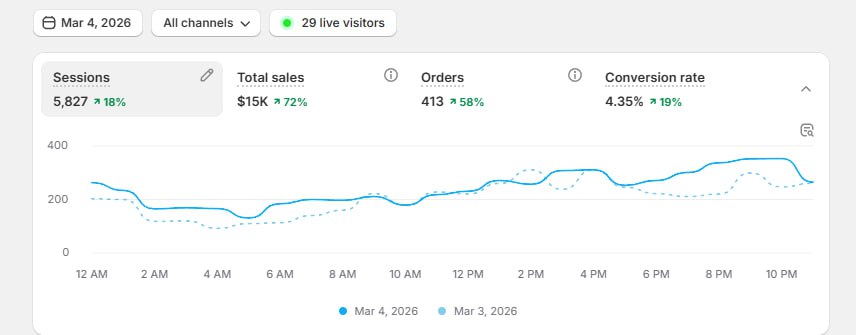
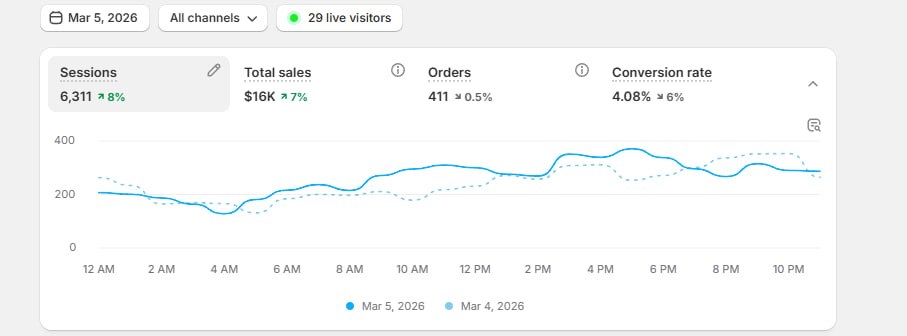
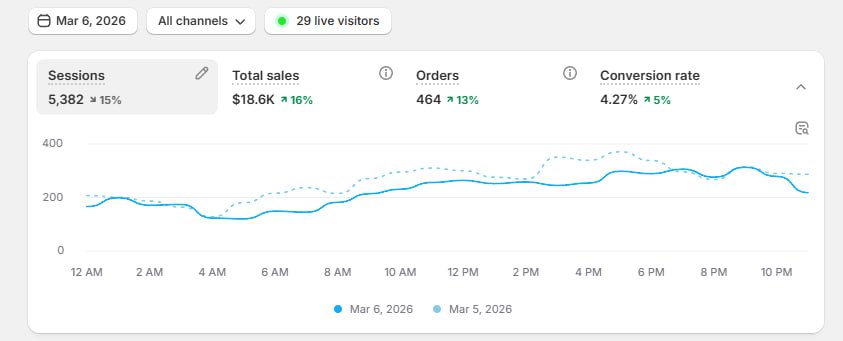
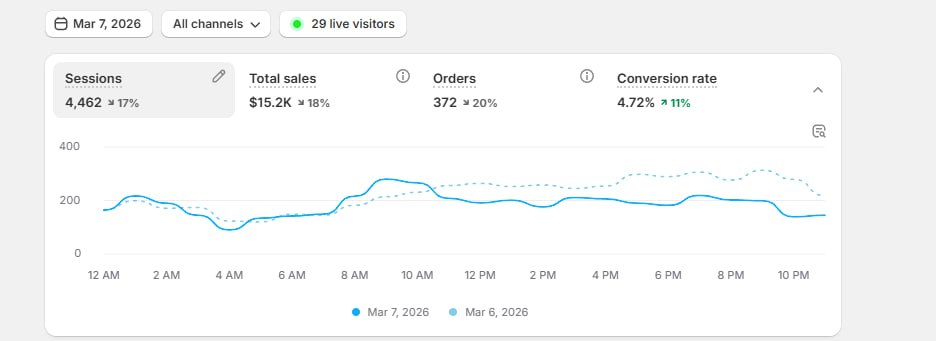
March The New Normal Mar 1–13 | $6,600–$18.6K/day | 232–464/day | 3.3–5.44% | Scale sustained. Mar 6 hits $18,600 — the peak. Mar 4 delivers 413 orders. $10K+ days are now the baseline, not the exception. | SUSTAINED SCALE |
January — The Ramp
The partnership starts. Offer testing is live. The account is building toward something.
Early February — The Explosion
Winning offer structures lock in. The account steps up to a completely different level almost overnight.
March — The New Normal
$10K+ days aren’t the ceiling anymore. They’re the floor.
The Number That Tells The Story Feb 3 to Feb 4: sales went from $2,722 to $7,538 in 24 hours. That’s not a gradual climb — that’s what happens when the right offer meets the right creative and the account is set up to capitalise on it. By March, that level of performance wasn’t a spike. It was the new baseline. |
Why This Is Built To Work
Offer testing is where most brands leave money
Creative gets most of the attention in e-commerce advertising. Offer gets almost none. But the offer — how something is priced, what’s bundled with it, what the value proposition looks like in the ad — can change conversion rate more dramatically than any creative tweak. This brand had the creative opportunity. Unlocking the offer structure is what turned that opportunity into $18,600 days.
Twenty SKUs is an advantage, not a problem
Most agencies treat a large catalogue as a complexity problem to be managed by narrowing it down. We treated it as a testing surface. Twenty products means twenty chances to find something that resonates unexpectedly. Some of the SKUs that emerged as strong performers at scale weren’t the ones anyone would have predicted. That’s the entire point of testing rather than assuming.
The data always knows before you do
The shift from $2,500 days to $7,500 days happened inside 24 hours. That kind of jump doesn’t come from a gut call — it comes from having enough data in the account to know exactly what to push and when. Every week of review, every underperformer cut, every winner scaled — that’s what builds the conditions for a day like Feb 4 to happen.
Scale that holds is built differently than scale that spikes
The Feb 4 jump could have been a one-off. March shows it wasn’t. Consistent $10K–$18K days across two weeks isn’t a lucky run — it’s a system that’s found its stride. The offer structures are proven. The winning SKUs are identified. The creative is iterating on what’s already working. That’s what sustained scale looks like versus a lucky week.
Project Scope at a Glance
Deliverable | Details |
|---|---|
Ad Account Audit | Full review of existing campaigns, creative, SKU performance, and offer structure from day one. |
Offer Testing | Systematic testing across bundle deals, volume discounts, and single-SKU offer variations across all 20 SKUs simultaneously. No assumptions about what would win. |
Full Catalogue Creative | Creative built to represent the entire product range — not a handful of assumed hero SKUs. Every product got a fair test. |
Static Ad Production | High-volume statics built around the offers and SKUs showing early traction, iterated rapidly as data came in. |
Video Ad Production | Video creative extended the winning angles from static testing, adding depth to the formats already showing performance. |
Weekly Creative Review | Every week: full analysis of what shipped, what performed, what to scale, and what to cut. Direction set by data, not opinion. |
Ongoing Scaling | Active creative partnership maintaining $10K–$18K+ daily revenue and pushing further. |
Where We’re Headed
Holding the Floor and Raising the Ceiling $10K–$18K days are the current range. The infrastructure is built, the winning SKUs and offers are identified, and the weekly review loop is running. The next phase is pushing the ceiling higher — more creative volume on the proven angles, expansion into offer combinations that haven’t been tested yet, and continued iteration on the SKUs that keep showing upside. This brand has more in it. We’re not done finding it. |
This is a live partnership. The screenshots above are where we are right now. The story keeps going.


What’s apptics Max
What types of businesses do you work with?
Can you manage projects end-to-end?
How does your pricing work?
What is your typical project timeline?
Do you offer post-launch support?
How do we get started?


